Further look into song attributes data 


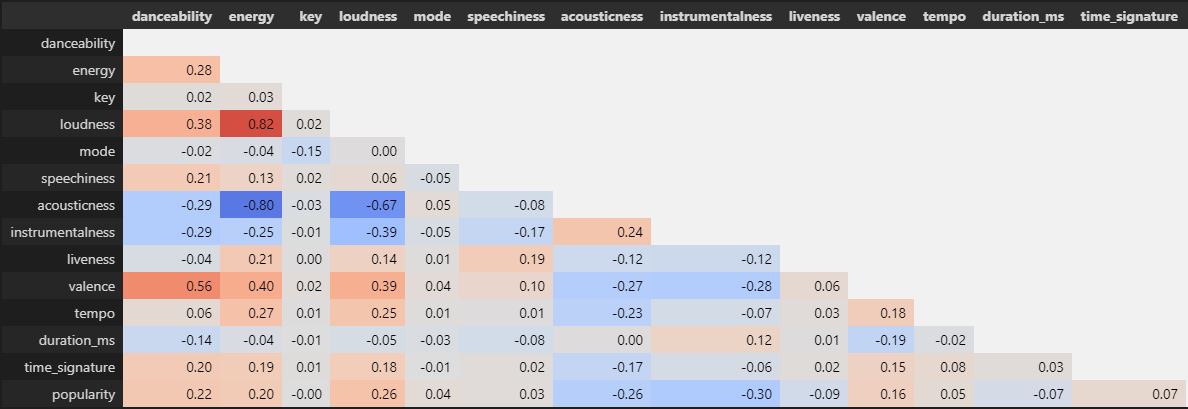
Before runnig any machine learning over the datasets, it is useful to take a look and see if there are any obvious correlations. MatplotLib was used to create some quick scatter plots comparing some song attributes which may have relationships.

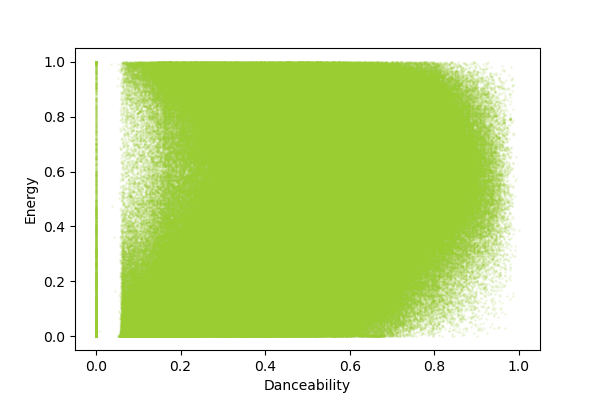
Energy vs. Danceability

Danceability v energy

Energy vs. Accousticness

Accousticness

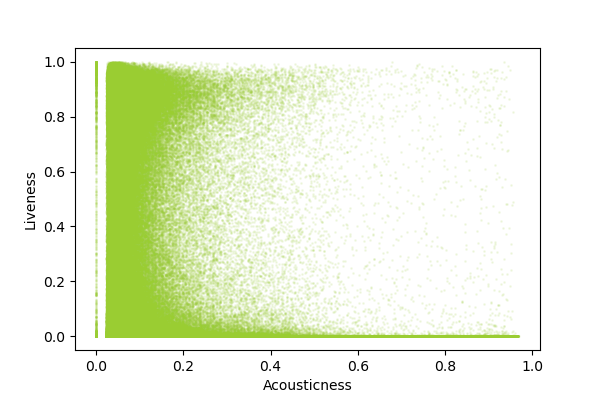
Liveness vs. Accousticness
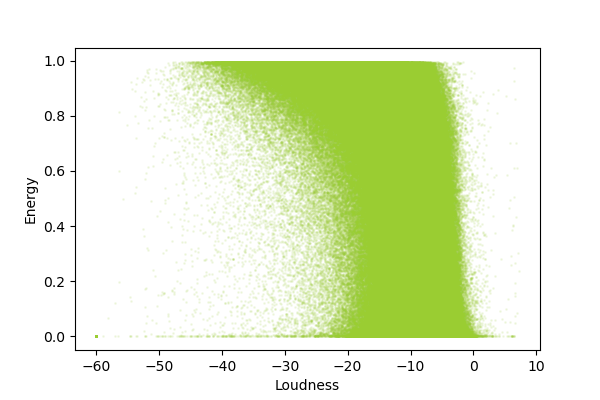
Accousticness

Energy vs. Loudness

Heatmap Correlations

Taking a bit of a further look into a correlations heatmap table shows us that there are positive and negative correlations between many of the track characteristics. The strongest positive correlation being energy vs loudness (r=.82). The strongest negative correlation being accousticness vs energy (r=-.80). Unsurprising.

Will these help differences help my model once to predict popularity?

Correlation table